Vision
At Maon, our mission is to revolutionize decision-making in energy markets by providing unparalleled foresights.
Why?
In today’s fast-paced energy markets, the need for accurate forecasting and data-driven decision-making has never been greater. With factors like climate change, policy shifts, and technological advancements constantly reshaping the landscape, staying ahead of the curve is essential for success.
Traditional approaches to market analysis often fall short in providing the depth, speed, and consistency required to navigate in this complex environment. Decision-makers are left grappling with uncertainty, risking costly missteps or missed opportunities.
This is where Maon comes in. Our platform offers a pioneering solution to the challenges faced by market participants. By harnessing the most advanced engineering and information technologies, we empower users to anticipate future trends, identify emerging opportunities, and mitigate risks with exceptional accuracy.
Consider the implications for grid operators tasked with ensuring a reliable energy supply during fluctuating demand and weather patterns. With Maon, they gain the foresight needed to optimize grid operations and plannings, prevent disruptions, and meet the needs of millions of consumers efficiently.
Similarly, traders and investors can leverage Maon’s fundamental forecasts to identify profitable opportunities within minutes. By analyzing multilayered and highly consistent data, they can make resilient decisions that maximize returns and minimize risks in a dynamic market environment.
In essence, Maon is not just a tool for predicting the future – it is a strategic asset that empowers decision-makers to navigate in uncertainty with confidence. By choosing Maon, you are choosing to stay ahead of the curve and seize opportunities in an ever-evolving industry.
Cooperate and win
You and your team members can use all features with just a web browser and an internet connection. No additional downloads or installations are required. Figure 1 showcases the browser-based graphical interface, along with typical features.
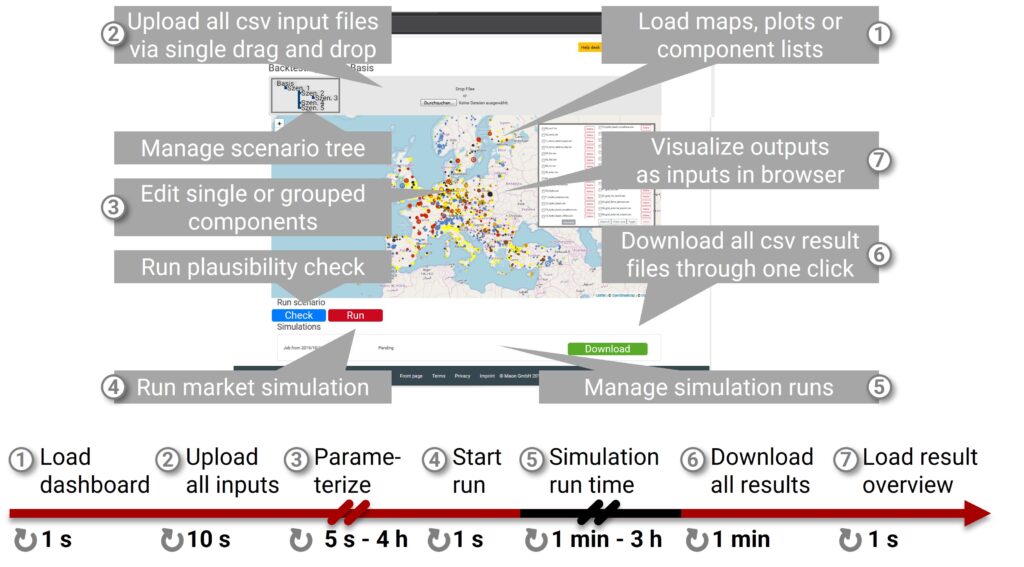
Figure 1: Interface and features
The graphical user interface offers a wide range of uploads, downloads, parameterizations, and visualizations. Intuitive and guided interfaces make it easy to use. For instance, sensitivities can be parameterized and initiated in under one minute.
Thanks to its responsive design, the platform is accessible on the go or from home using a tablet or smartphone. Maon supports non-linear and parallel usage, enabling to do tasks in any order and distributed among multiple teams.
It ensures model correctness through clear visual data summaries and facilitates joint result analysis for optimal quality management. The solution encourages close teamwork across various projects, processes, as well as product and service developments.
Rely on scientific laws
The solution simulates the degrees of freedom of batteries, demands, hydropower networks, interconnectors, renewables, and thermal power plants, with quarter-hourly granularity over whole years for entire Europe. The data undergoes the most advanced approach from scientific research, a three-staged optimization problem solving procedure, displayed in Figure 2.
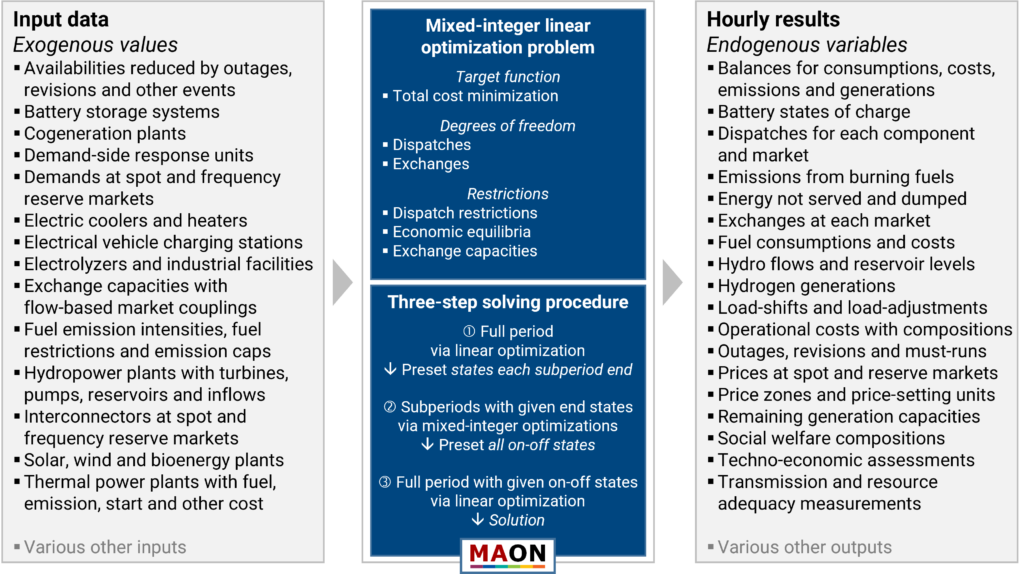
Figure 2: Fundamental electricity market simulation to derive dispatches
The first and third step of the procedure simulate seasonal couplings, such as hydro reservoir levels. The combinatorial complexity is addressed in the second step by optimizing each subperiod individually. This approach allows for considerations like integer restrictions, such as minimum power or minimum uptime.
Users have full empowerment within the environment, enabling them to modify all input data and download all output data. Once a simulation is initiated, the simulation runs automatically in the background on a high-performance computing cluster.
With a positive data check, we guarantee a seamless run without interruption. In the event of failure, users receive a problem description along with a proposed solution, minimizing the need for manual data processing. Additionally, it offers fully automated aggregation methods to do fast-mode runs. Using the fast-mode, preliminary results can be obtained within minutes.
Forecast realistically
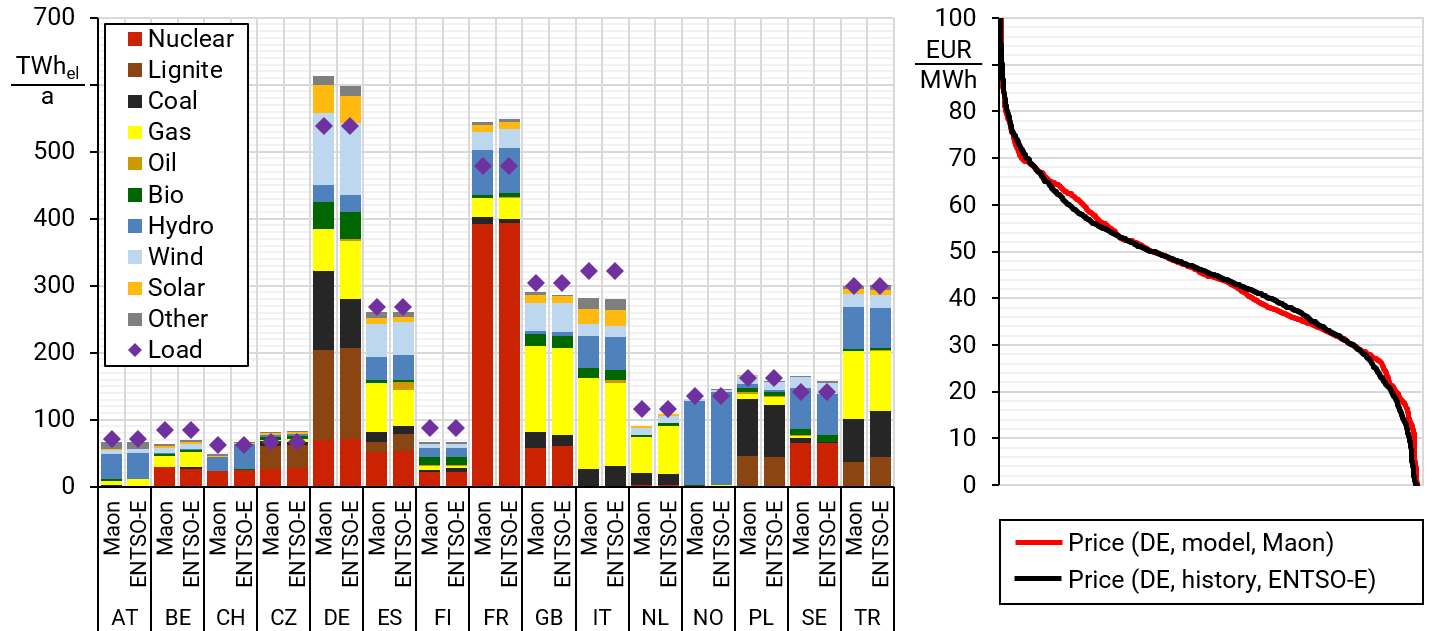
Figure 3: Exemplary electricity generation amounts and price duration curves
Generation amounts and spot prices closely approximate historical values, enabling the derivation of Europe-wide, annual and high-resolution schedules and prices. Additionally, raw results are automatically processed to thousands of derived results to do for example social welfare deep dives, pricings of power purchase agreements, or cost-benefit analyses for individual portfolios.
Deliver today
Achieving comprehensive foresights requires covering both, dispatches and investments. To bridge the gap, the solution contains the same models across all modules and seamlessly integrates them. Thereby, we can, for example, choose one dispatch scenario for 2018 and another for 2050, and then run all 31 annual simulations in between through one click, without the need to manually create annual datasets. This general approach, depicted in the graph below, unlocks new forecasting possibilities.
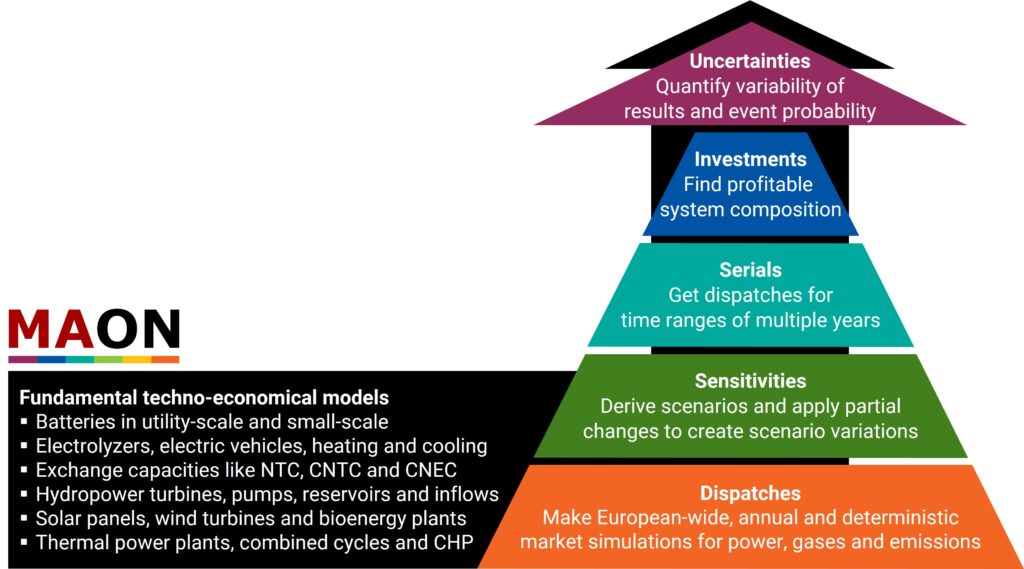
Figure 4: Pyramid of modules to create holistic and consistent foresights
This pyramid enables not only the re-use of single-year scenarios in series of runs, but also in fast estimates, sensitivities, investment forecasts, and stochastic simulations. It derives the consistency among dispatches, investments, and their uncertainties.
Additionally, the modules streamline scenario mixing, individual parameterization, quality management, simulation, output extraction, as well as result analysis and comparison, allowing their completion within a single day.
Key takeaways
Decisions in energy markets are all about the future. However, the future is driven by a mix of dynamic factors such as climate change, public policy, and innovative technologies. To make optimal decisions, complex outcomes need to be forecasted with speed and accuracy.
Resilient forecasts are crucial for traders, investors, and plant operators. Same applies to grid operation and planning, as well as topics of public interest, like market design analysis or security of supply assessments. Far-reaching decisions have to be made.
To solve these challenges, our platform enables to do detail-rich large-scale fundamental electricity market simulations. It stacks the most advanced engineering and information technologies, to achieve a leading-edge degree of realism. By generating prices, dispatches, investments, and their uncertainties, the user can pinpoint the most beneficial option.
Maon supports non-linear and parallel usages for superior cross-organizational teamwork. To start immediately, input data with close-to-reality results is available. Users can promptly analyze mission-critical results, through interactive graphs and maps directly in their browser. Thousands of results substantiate the driving forces, ensuring transparency and understanding.
In high-stakes energy markets this gives a remarkable advantage. It predicts the future so it is possible to choose the right action in the right moment. With Maon, you can make the most accurate and certain decisions within minutes, knowing what to do and what not to do.
Before you commit to your next big decision, how confident are you that it is optimized to consider every factor and that you know all the possible future outcomes that could benefit you? Leading grid operators, business consultants, and public authorities trust Maon to provide exceptional decision insights. We can do the same for you.